Zipkin
The integration with Open Telemetry is fully native in the Devprime platform, simplifying the journey of the software developer with the use of this resource that adds a lot of value in the scenario of distributed systems, allowing you to track a business process in all the microservices involved.
The main Cloud platforms in the market are already supporting Open Telemetry, which facilitates adoption in the production environment. There is the option to use it in kubernetes or any other managed solution.
In the context of our demonstration we will use a local docker container to have the data collector and the Zipkin tool.
Follow the steps below:
-
Install the Devprime CLI.
-
Initialize the Zipkin container provided in the docker documentation.
-
Clone the repository with the two microservices (ms-order/ms-payment) or deploy manually.
git clone https://github.com/devprime/devprime-microservices-order-payment.git. -
Update the Stack by running in the main folder to detect the two microservices
dp stack -
Locate the configuration file in the folder of each microservice that in this example mentioned in item 2 we will use “ms-order” and “ms-payment”.
a) Open the file in Visual Studio Code inside the microservice folder
code src/App/appsettings.json
b) Open the Observability key and verify that the Enable option is true. Then go to the Trace option and set the Enable to true, Type to zipkin and the Endpoint with the url of the service. In local docker the url has the default value of “http://localhost:9411/api/v2/spans”.
|
|
- Run the ‘ms-order’ microservice and notice in the log that the configured Open Telemetry information will already be in place. The log already shows that the Trace is set to Enable and the Type set to “ZipKin”.
|
|
Tracking the trace of a microservice
- Run the ms-order microservice
- Open the browser in http://localhost:5000 and make one or more posts in /v1/order
- Open Zipkin in the browser in http://localhost:9411 and view
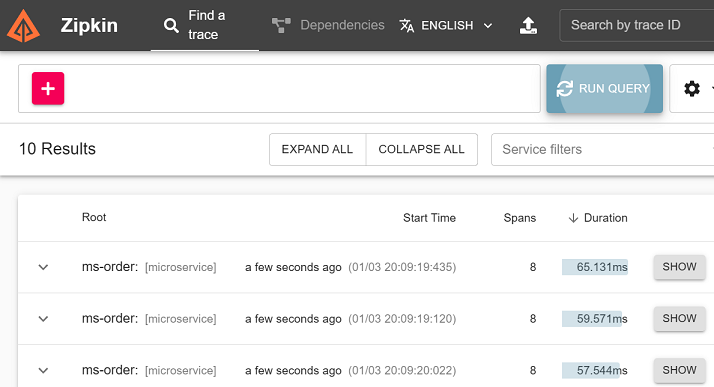
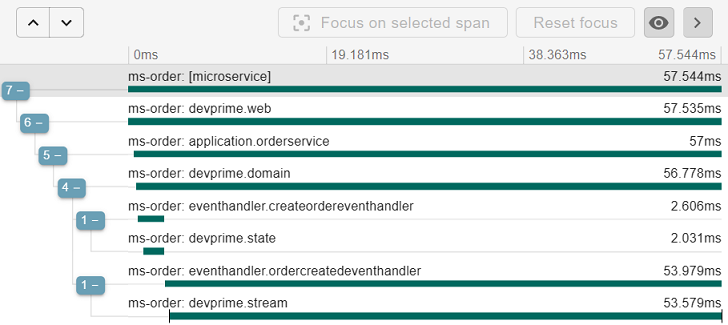
- Check all processing details
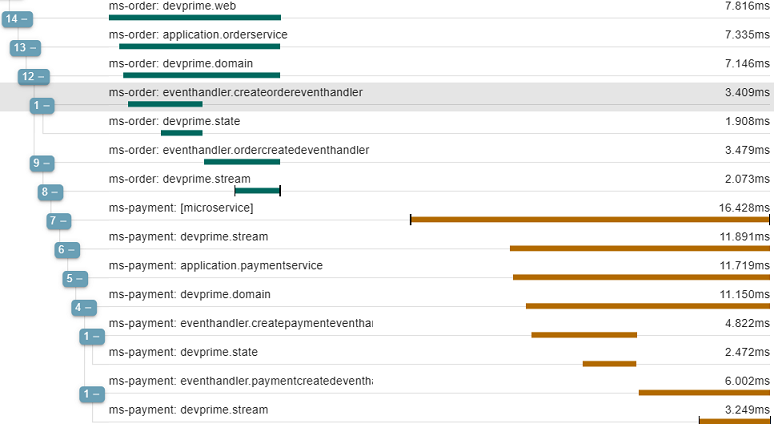
Tracking the trace of two or more microservices
- Run both microservices (ms-order / ms-payment)
- Make a post to the ms-order microservice
- View details on Zipkin
Legal information:
Zipkin is an opensource tool compatible with the Open Telemetery standard. Any information on licensing and use we recommend the manufacturer.